How's the Nutanix Cluster ?
The often asked question …
As you deploy, implement and/or use any new technology, there is a phase where most people keeps wondering if things are working the way it should until it’s assumed everything is OK.
To this day, some still can’t believe that you can move virtual machines between hosts with no downtime.
As faster broadband gets rolled out, we all do speed tests to “check” … (or is that just me?)
So when you start replacing traditional datacenter infrastructure with hyperconverged (HCI), you get the daily or bi-daily question : “How’s the Nutanix Cluster ?”
The standard way to answer
On Nutanix, answering the question is easy :
- open a browser
- open the webpage for Prism
- login
- check on the dashboard that everything is OK (CPU, RAM, Storage usage)
There’s nothing wrong with that method but when you’re being asked often enough … well that’s when you start being creative.
The API way to answer
With Prism being API driven, it’s really easy to get those answers via some simple scripting … at least on the Mac (working something out for Windows and Powershell).
So I built a Automator workflow that :
- checks vital stats of a cluster
- display a notification with the above stats
- let Siri talk about those stats
The API way in details
First things first, on macOS you should have Homebrew installed. If not, please do.
Once done, we will need a small tool called jq. This is a simple yet awesome command line JSON processor that will be quite useful to process Prism answers to our requests.
brew install jq and you are set.
Cluster name
Now let’s switch to Automator and add a “Run Shell Script” actions, with the following script :
1curl -X GET --header 'Accept: application/json' 'https://IP_For_Prism:9440/api/nutanix/v2.0/cluster/' -k -basic -u USERNAME:PASSWORD -s | /usr/local/Cellar/jq/1.6/bin/jq '.name'
Add a “Set Value of Variable” to store the result in ntnx_clustername
CPU Usage
Add another “Run Shell Script” action :
1curl -X GET --header 'Accept: application/json' 'https://IP_For_Prism:9440/api/nutanix/v2.0/cluster/' -k -basic -u USERNAME:PASSWORD -s | /usr/local/Cellar/jq/1.6/bin/jq '.stats.hypervisor_cpu_usage_ppm|tonumber /10000' | read cpu
2printf "%0.2f\n" $cpu
Add a “Set Value of Variable” to store the result in ntnx_cpuusage
RAM Usage
Add another “Run Shell Script” action :
1curl -X GET --header 'Accept: application/json' 'https://IP_For_Prism:9440/api/nutanix/v2.0/cluster/' -k -basic -u USERNAME:PASSWORD -s | /usr/local/Cellar/jq/1.6/bin/jq '.stats.hypervisor_memory_usage_ppm|tonumber /10000' | read ram
2printf "%0.2f\n" $ram
3
Add a “Set Value of Variable” to store the result in ntnx_ramusage
Storage Free Space
Add another “Run Shell Script” action :
1curl -X GET --header 'Accept: application/json' 'https://IP_For_Prism:9440/api/nutanix/v2.0/cluster/' -k -basic -u USERNAME:PASSWORD -s | /usr/local/bin/jq '.usage_stats."storage.free_bytes"|tonumber /1024/1024/1024/1024'| read freetb
2printf "%0.2f\n" $freetb
Add a “Set Value of Variable” to store the result in ntnx_freespace
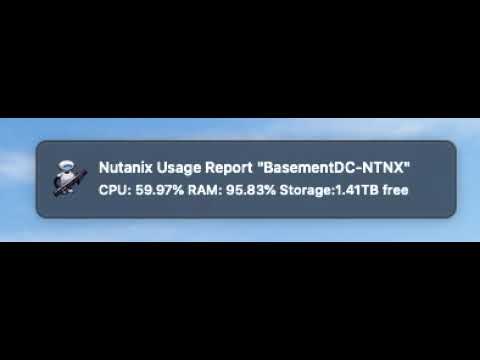
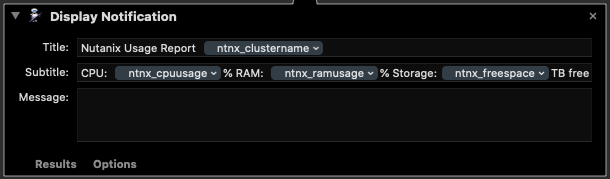
Notification
Add a “Display Notification” and set the clustername in the Title and CPU Usage, RAM Usage and Storage Usage in the subtitle.
You could just save that workflow and export as an application. Next time someone asks how the cluster is doing, run the app (you could even ask Siri to start your app).
You promised me a Siri notification !
Yes and it’s 50% correct … we’re going to use Siri’s voice.
In macOS System Preferences, select Accesibility and then Speech. You can then pick Siri’s voice (based on gender and nationality).
Let’s add the voice
Add the “Get Value of variable” action for ntnx_clustername.
Add a “Run Applescript” action with :
1on run {input, parameters}
2
3	say "Nutanix Usage for cluster " & input
4
5
6end run
Then repeat those steps for CPU, RAM and Storage and changing the script accordingly.
Save the workflow and export as an app. You now have a visual and voice notification telling you how your cluster is doing.
Conclusion
In just a few lines of code and thanks to Automator, you can now easily check your cluster status.
You can download the workflow on my GitHub … just don’t forget to change the various scripts to have your own Prism instance and associated credentials.